Mr Jonathan Jones

Mr Jonathan Jones

SEO & Digital Consultant

Pre-filtering reports in Google Data Studio

Google Data Studio has a lot of functionality when it comes to filtering, and I use the filtering constantly, least not the default “filter control” options that are available which allow you to filter by dimension:

However, I got this question from someone using the report I created and shared yesterday (Google Data Studio Alternative to Google Search Console – exporting by date) about filtering out the Query data to NOT contain certain queries and I was going to simply respond to the comment saying that you’re able to use Regular Expressions (see the ‘Query -> REGEXP’ example above) to do exactly that. You can see this question below:

As an aside, I am so humbled and pleased by the fact that so far on Twitter, the response to sharing the report has been massively well received, we’re about 266 likes and 89 re-tweets in and my phone is still buzzing away as I write this at 8:11 AM. Dawn Anderson, who I hugely respect in the SEO industry, also shared the post on LinkedIn!

Back to filtering…

Not to detract from the subject of this blog post, so going back into it: what if you wanted to remove queries that just were not relevant for your report in Google Data Studio?

Introducing ‘Report Settings’ in Google Data Studio

So, if you’ve already got a snazzy report setup, and you want to either 1. Filter out the query data to only contain certain queries or 2. Filter your queries to not contain certain queries, on a more permanent basis, then this is all feasible within the powerful filtering options that exist within Google Data Studio.

All you need to do is go to ‘Report settings’, which you can find in the top left hand corner menu under ‘File’:

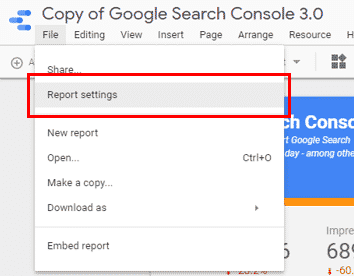
Once you click ‘Report settings’ a menu will open up on the right hand side of your monitor:

The option that we’re looking for here is the ‘ADD A FILTER’ option. In Google’s own words, this is what this does to your report:

Configuring a filter in the report settings panel sets it as the default for the entire report. All components that share the same (or similar) data source are affected by the filter. You can override this by turning off filter inheritance for a selected component.Google Data Studio

So we can conclude by adding this filter, it’ll impact your entire report.

Once you click that ‘ADD A FILTER’ option, you’ll be presented at the bottom of your screen to ‘Create a filter’ – I won’t screenshot this as I’ve got a lot of images on this post already. Once you click that, you’ll be presented with the below filter options and you’ll have the ability to ‘Exclude’ or ‘Include’ and then the option to filter directly by dimension:

Going back to the original question, Andrew Coco wanted to filter by Query to exclude certain keywords. In this report, I’ve setup a very basic filter that will exclude the Query dimension, with strings that contain ‘youtube’ from the Site Impression table:

This then removes all traces of the word ‘YouTube’ from the entire report.

I can see where this might be useful, as you’ll be able to setup reports that exclude branded search terms or that might only include branded search terms.

Chart Inherited Filtering

Because we set this up via the ‘Report setting’ section in Google Data Studio, all of the charts in the report will inherit this filter. You’ll be able to see if this is the case by selecting any of the charts in your report:

You can simply toggle off or on this filter as you wish and even setup a chart specific filter, depending on what you’re trying to achieve.

That should hopefully answer the question in probably a certain amount of detail that Andrew Coco was not expecting, but it was a good question, so I thought I’d give it a good answer. 🙂

What am I looking at next?

I think my next blog post for Google Data Studio is showing everyone how you can create drop downs that allow you to toggle easily between groups of keywords that you’ve grouped together through creating Calculated Fields, so that you’re able to, for example, create a drop down menu that will give you the option to filter from branded search queries to generic search queries. This relies on using Google’s CASE function, which is yet another powerful part of the platform.

Stay tuned!

Use Google Data Studio to Export Google Search Console Data by Date


If you’ve been using Google Search Console recently, you’ll have spotted that Google recently retired the old Google Search Console user interface for the Search Analytics report on the 13th of December, 2018 with their more Firebase looking interface. This has left people without core functionality that existed before, but fear not – Google Data Studio is the solution! Read more below:

There are pros and cons to the new user interface, and many are already finding that the functionality that existed before does not exist within the new Google Search Console interface. In particular, my favourite part of the platform is the Google Search Analytics report. This particular report allows you to download keyword data, whether that is Impressions, Clicks, CTR or Average Positions. These are all super useful metrics that allow you to measure performance. However, the problem that people are running into is the fact that within the previous Google Search Console report, you could export data, whether on a single keyword level, broad level or for multiple terms on a trended and daily basis.

You can’t export by date…

In the new Google Search Console, you can only export snapshots of data which is not very useful if you’re trying to marry separate data sources or trying to export the data to visualise via Excel for that super important presentation you’ve got to complete with this data source.

Update [23rd of September, 2019]: It is now possible to export by date in the new Google Search Console as per Google’s announcement on the 23rd of September, 2019: 

I would still recommend continuing with this tutorial as Google Data Studio is pretty damn awesome and there’s so much more you can do to segment your data further than what you can do through the Google Search Console UI. 

Google Data Studio to the rescue!

In light of this, I’ve created a dashboard in Google Data Studio that anyone can re-use and download:

Click to view the Google Search Console 3.0 – Data Studio Report

Jonathan Jones

I’ve taken the liberty to screenshot the report itself – below:

Google Search Console 3.0

The key aspect here is that you can better visualise data in Google Data Studio because you can customise the report to your specific needs. However, if you’re landing on this page wanting only the ability to export data by day then you can see in the report I’ve added that table in the bottom left hand corner.

The three little dots…

You’ll see that you can export the data by day/trended view, when you hover over where I’ve highlighted below with the circle with your cursor. This will show you 3 little dots, as seen below:

Download options

Once you click those three little dots, you’ll be presented with the below with some download options:

I tend to download first into Google Sheets because for some reason Google Data Studio rounds the data when you export directly into Excel via a CSV – which might I add is rather annoying – but I suppose works for Google as you’re using yet another service they provide.

Whilst I export into Google Sheets, I tend to copy and paste the data in Excel as it’s my preferred method, but if you like Google Sheets then keep the data in there. This is what the data ends up looking like, and is pretty much the same as what you would have been able to do in the old version of Google Search Console:

And the benefits of the new Google Search Console API mean you can download 16 months worth of data on a daily/trended view, versus the 90 rolling days that was present in the old Google Search Console.

How can you get started with this?

If you access the link to the Google Data Studio report that I shared earlier, and that I’m sharing again, you’ll be able to see the below option to copy the report (see red circle):

Once you click that button, you’ll be presented with below to link up your Google Search Console account with Google Data Studio (effectively this swaps out the reference from the existing Google Search Console account connector, with your account connector):

Connect your Google Search Console account to Google Data Studio

If you haven’t got Google Search Console connected already, then you’ll have to click on ‘Create a new data source’.

It is relatively straightforward to connect your Google Search Console from this point.

IMPORTANT – Use and connect the Site Impression table for Google Search Console and NOT URL Impression

You’ll want to connect your ‘Site Impression’ table to this report as that is what I’ve used to create the report.

I’ve elected to use the Site Impression table over the URL Impression table because the data within the URL Level Impression table is not as reliable as the Site Impression table – for quite a few reasons.

I’ll need to write a separate blog post on why I believe that to be the case, but this report I’ve created, a la the ‘Google Search Console 3.0‘ allows you to filter by certain keywords, and other fields, including the options to use Regular Expressions.

So for now, use the Site Impression table, though I am looking to test joining together and blending Site Impression and URL Impression tables, so that you have the ability to filter by landing page by filtering from the Site Impression data only. You can see two options below – select ‘Site Impression‘:

Invalid Metric Issues – how to resolve these…

Once the data is imported, you may come across some issues which are simple to resolve. I’ve seen that sometimes the metrics don’t carry over properly for one reason or the other. All you need to do is re-select the ‘invalid metric’:

In this case, the ‘invalid metric’ is Site CTR. All you need to do is re-select this metric – 

This issue seems to have cropped up and has killed all of the tables and charts with the “Site CTR” metric. The fix is simple, so I’m confident that people can fix this with the advice I’ve given above. 

To end with…

I am increasingly a fan of Google Data Studio for the versatility that it offers, and with the increasing amount of brand new features that are coming out. It’s automated a lot of my workload, so I see it as a very powerful tool to use and to identify issues.

Hopefully, if you’re reading this, you’ve found this useful. Feel free to comment below if you need any help with setting this up.

Frequently Asked Questions

Am I still able to pull data by day from Google Search Console? 

In short, the answer is yes. Google Data Studio gives you this ability. 

Can I pull data by device type? 

Yes, you can add this as a breakdown dimension which will allow you to pull data over time by all three device types – Mobile, Desktop, and Tablet.