Want to combine your Google Search Console & Google Ads data together?
The premise of this post is to outline how I’ve personally gone about combining Google Search Console and Google Ads (formerly AdWords) data on a query, device and overall level. This should hopefully give you an idea of how you can go about combining these two data sources to create either your own dashboards or to simply use the dashboard template that I’m providing for this exercise.
Why should you add Google Ads & Search Console together?
Here are a few reasons:
- You’ll be able to make use of some of the 115 fields that exist in Google Ads that can be used in conjunction with Google Search Console, which have only 9 fields in total.
- Using metrics such as CPC allows you to value how much organic traffic is worth to your business, or even using the Conversion metrics in Google Ads to estimate on a keyword level the value of your search terms to your business on an individual query level on the organic side are things you don’t have now.
- On the opposite end of things, Paid Search teams might find the data useful for keyword research purposes and for the query & impression data that is in Google Search Console.
- Ultimately, and frankly the best reasons for combining the data is to have an on going and automated view on how your paid efforts might be impacting your organic search efforts, and vice versa. You’ll also be able to see where organic is showing for results and where paid search might not be showing up for queries (for whatever reason).
There are of course many more reasons, and it’s up to you to find reasons in order create a report that is actionable and useful for your stakeholders (or yourself).
Table of Contents
Is there a template I’ll be providing?
Of course! I’ve created a template which I’ll give out to people so that they can re-use this and add their data sources, which is the best way to go about it. I’ve used the sample data that Google supply for their Google Shop, which fortunately comes with Google Ads & Google Search Console data, so there is data there to marry up the two data sets.
This is the template I want to help you build:

What do you need access to?
You’ll need access to these data sources:
- Google Search Console (read only at minimum)
- Google Ads (read only – with access to the relevant campaigns).
So if you’re reading this and you work in Paid Search, get access to Google Search Console; and, if you’re reading this and you work in Organic Search, get access to Google Ads + the relevant campaigns. This should be easy enough (hopefully)!
Adding the data sources to your report
Once you have access to both Google Search Console and Google Ads, you’ll need to add both data sources to the same report. You can see below that I’ve added the Google Search Console Site Impression Table and I’ve added the Google Ads account to ‘New Data Source’ column in the prompt below:

If you’ve not already added these data sources to Google Data Studio, you’ll see the prompt below where those fields for ‘New Data Source’ are blank. The above is the endgame and is where you want to get to.
If you already have the Google Search Console and Google Ads data connected in any other Google Data Studio report, then click on ‘Select a datasource’ for each option and find the Google Search Console and Google Ads data sources that you would like to add and that are relevant in the context of each other – do they both contain the same Queries in them – as we’ll be joining them through using Google Data Studio’s blending functionality.
Create a new data source
Add Google Search Console Data (mini tutorial)
Google Search Console Import
When you click on the first drop down (across from “Site Impression – Google Search Console – CC“) of where it says ‘Select a datasource’, you’ll have the following list show up. If this is the first time you’ve added Google Search Console data to Google Data Studio under the email you’re logged in at, then you’ll have to click on ‘CREATE NEW DATA SOURCE‘:

Once you click the above, you’ll go to the API lists page where it details all 18 official connectors. You’ll need to find the Search Console API connector, and to speed things up, you can simply type in the name of the connector itself below: 
Once you select the above, you’ll be presented with all of the websites where you have access to Google Search Console under your Google Account:


Click on ‘ADD TO REPORT’, and then that should be it. You’ll go back to the original screen you started on – where it asked you to add the source in the first place to replace the ‘Original Data Source’:

You’ll see that the Google Search Console row has been populated with my personal website’s Google Search Console Account. If you click on ‘Add Google Ads Data’ below, you’ll be able to see how to import Google Ads into Google Data Studio.
Add Google Ads Data (mini tutorial)
Google Ads Import
When you click on the second drop down (across from “CC – Google Ads“) of where it says ‘Select a datasource’, you’ll have this list show up. If this is the first time you’ve added Google Ads data to Google Data Studio under the email you’re logged in at, then you’ll have to click on ‘CREATE NEW DATA SOURCE‘:

Once you click the above, you’ll go to the API lists page where it details all 18 official connectors. You’ll need to find the Search Console API connector, and to speed things up, you can simply type in the name of the connector itself below:
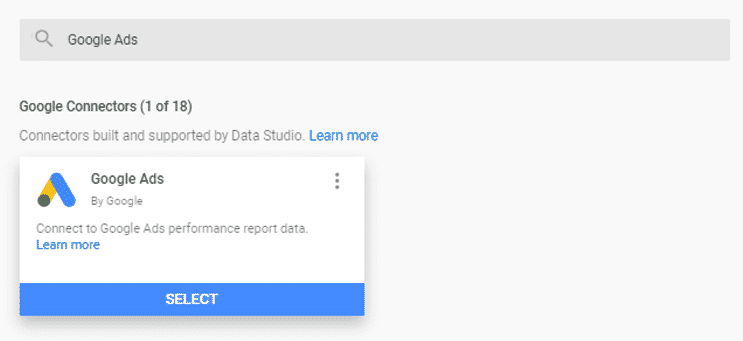
Select ‘MANAGER ACCOUNTS’, then select the relevant account – along with the relevant campaigns under that account:

Hit ‘Connect’ after selecting the account and campaign(s), which should then lead you to this:
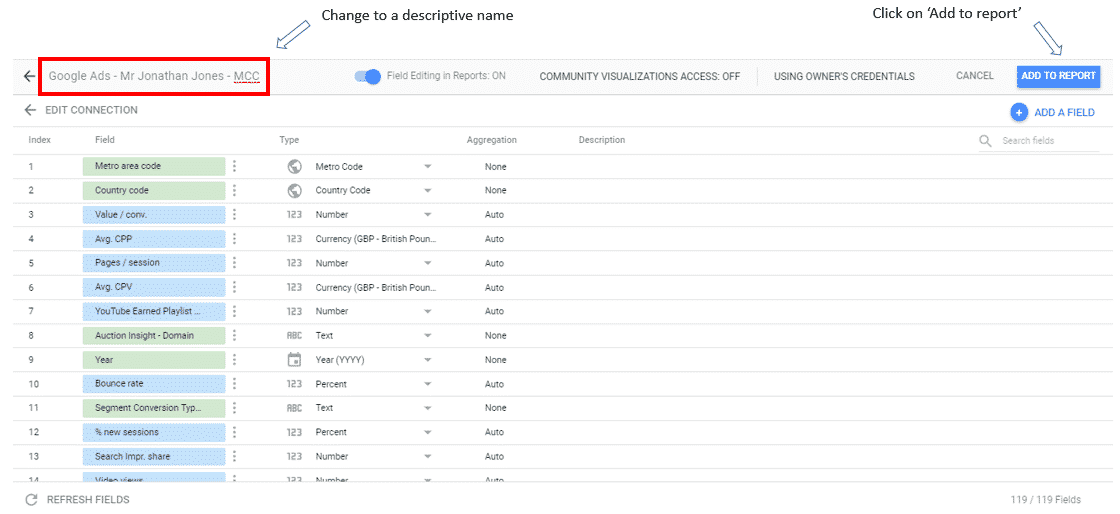
Finally, you have linked up your data sets to my reporting template:

You now have both Google Search Console and Google Ads added to Google Data Studio. The next step is to now blend both data sets.
Blending Google Search Console & Google Ads data sources
You’ve now reached the next stage, which is actually blending the two data sources together. All we’ve done so far is add the data sources to Google Data Studio. Blending is the fun bit!
So what is blending you ask?
A relatively new feature, the Google Data Studio team describes this as the following:
You create a blended data source by joining the records in one data source to the records of up to 4 other data sources. To join the data, each data source in the blend must share a set of one or more dimensions, known as a join key.
The key aspect here is the term “join key” which the GDS team have gone so far as to add italics to those words in their documentation. We need to find a shared/common aspect between the data sets and join them together – this is the join key essentially.
To start off with, we need to actually blend our two data sources that we have together.
Step 1: Manage blended data
In the report you’ve got, you’ll need to find the ‘Manage blended data’ page. It is located up in the menu at the top under the menu ‘Resource’:

This will take you to the screenshot in step 2.
Step 2: Adding Google Search Console & Google Ads
Click on ‘ADD A DATA VIEW‘:
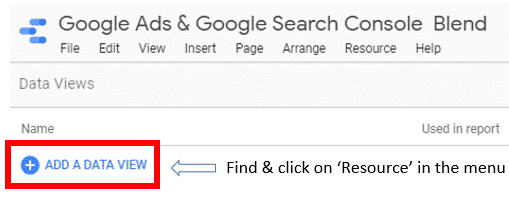
Add Google Search Console:
It’s important to add the Google Search Console account to the very most left of the report as we’re doing a LEFT JOIN so that all records on the most left data source is matched with the records in the right data source. You can obviously switch these around if you think you are able to get more out of Google Ads being on the left side rather than the right side.
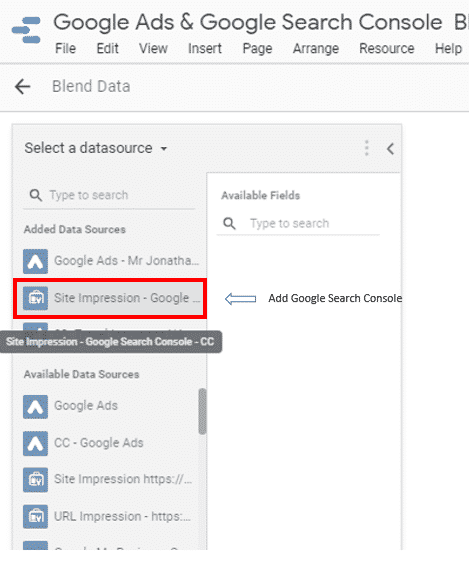
Add Google Ads:
Add in the your Google Ads data that you either already had in Google Data Studio, or you when you followed my tutorial above in adding Google Ads data to Google Data Studio:
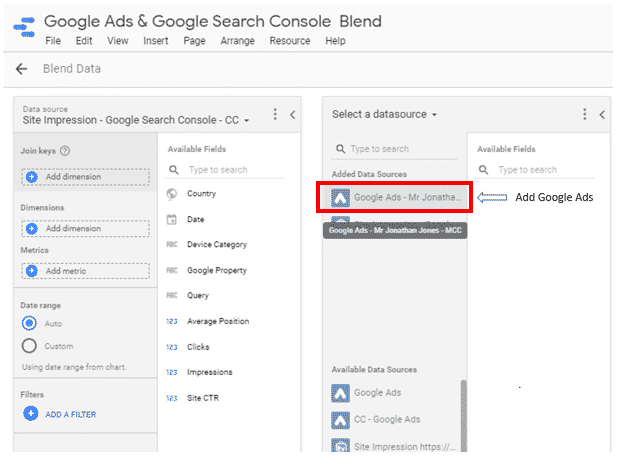
You’ll then get to the stage where you’ll see both data sources in this view:

You’ll see the ‘Join keys’ sections in both data sources and the option to ‘Add dimension[s]’ – not to be confused with the ‘Dimensions’ function below the Join Keys section.
Step 3: Adding the Join Keys, Metrics & Blend Name
I’ve marked the graphic below with an a), b) and c) to make this part easier to explain.
a) Join Keys: as I’ve explained in the graphic below, the Join Keys are the common elements between the two data sources. In Google Search Console & Google Ads, the common Join Keys where essentially the data is the same are the ‘Query’ (GSC) and ‘Search Term’ (Google Ads) dimensions, and ‘Date’ (GSC) and ‘Day’ (Google Ads), which is why I’ve added them below as the common Join Keys.
b) Metrics: Once the above Join Keys are setup, you can go to town and add everything you would like to add basically in terms of metrics. You’ll then be able to visualise them based on Query and Date range (Join Keys) in the Data Studio report itself. Re-name your metrics: you should re-name the metrics by clicking on where it says ‘AUT’, and I’ve done this and renamed the default Google Search Console names to highlight the fact that it is “SEO” and equally have done that to the one metric I’ve added on the PPC side called ‘PPC Clicks’, instead of simply ‘Clicks.
c) Blend name: You’ll want to give your blend as much of a descriptive name as possible, so that you don’t mix anything up and your blend(s) are easy to find. I’ve simply named this ‘PPC & SEO Blend’ as you can see in the image below:

I thought it would be smart to explain the rationale as to why we’ve picked these Dimensions for the Join Keys. You can see that rationale below:
Definitions of our Join Keys:
Join key definitions
Google Ads – Search Term
- Google has an explanation on the definition of ‘Search Term’ in Google Ads and they explain it like so:
A search term is the exact word or set of words that a customer enters when searching on Google.co.uk or one of our Search Network sites. A keyword is the word or set of words that Google advertisers create for a given ad group to target your ads to customers.
Google Search Console – Query
- On the flip side, we want to know what the definition of Query is so that we are sure what we are matching up makes the most sense. Google defines the Query dimension as follows:
The actual query a user entered in Google search.
So we know that these match up nicely now. Last but not least, we’ve added Date (Google Search Console) and Day (Google Ads) to the report. I won’t go into detailed explanation, but these two date Dimensions match up and use the same date format, so they work well as Join Keys.
Can you add a device filter, to filter both data sources at the same time?
Yes, it is possible to add a Join Key by device so that you can filter both data sets with the same filter by Mobile, Desktop & Tablet. However, Google Ads has an odd naming convention compared to Google Search Console, which requires you to match these names up in one of the data sources so that they can become Join Keys. Using a function in Google Data Studio called CASE, we can change the names of the Google Ads device type names to match what is used in Google Search Console for simplicity’s sake
In Google Search Console, the naming for each device is really simple and this is categorised under the ‘Device Category’ dimension:
- mobile, desktop, tablet
In Google Ads, the ‘Device’ dimension is categorised as:
- mobile devices with full browsers, computers, tablets with full browsers
Using the CASE function, as mentioned, we can change one of the data sources device dimension to match the other. Here’s an example of the Calculated Field you need to make using Google Data Studios’ CASE function:
CASE
WHEN Device = "computers" THEN "DESKTOP"
WHEN Device = "mobile devices with full browsers" THEN "MOBILE"
WHEN Device = "tablets with full browsers" THEN "TABLET"
ELSE "OTHER"
END
Create a Calculated Field to rename the Google Ads device fields
How to create a Calculated Field
In order to create a Calculated Field for the ‘Device’ dimension to rename the fields in Google Ads for the device dimension, you need to go Resource -> Manage added data sources: 
Click on the Google Ads data source that you need to edit: 
Click on ‘ADD A FIELD‘:

Copy & paste the following into the field editor:
CASE
WHEN Device = "computers" THEN "DESKTOP"
WHEN Device = "mobile devices with full browsers" THEN "MOBILE"
WHEN Device = "tablets with full browsers" THEN "TABLET"
ELSE "OTHER"
END
This is what it looks like in the Calculated Field editor:

Let’s create the report
It’s time to populate & create the report you want & potentially need. We’ll go back to the template that I created before.


Thank you so much for starting this guide. Will you be adding a link to the template soon? I couldn’t find the template link in the article.
Hi Ellen,
Apologies for the delayed response.
I’ve not yet added the template as that is a complication in itself. Due to using calculated fields and blending data, you can’t, unfortunately, share a template where you could easily transition one data set over to the other on a templated basis. Happy to share the design/visual look if that is at all helpful? 🙂 Please email me at [email protected].
Hi Jonathan, great article. I knew about Blended Data but haven’t figured out a way to visualize KWs for SEO and SEM simultaneously. Just one thing: I was getting unaccurate data for Search Console Avg. Position and CTR.
It was solved when I removed Date / Day as Join Keys. I guess this is what you mention in Step 3. Either way, thanks for the guidance.