New: Google Analytics 4 Made Simple: A New Looker Studio Template for 2025
This time last year in 2018, I released a Google Data Studio template for Google Search Console via the native connector in Data Studio. It’s one of my most shared tweets and articles on this website, and hopefully I have helped a lot of people with it.
In the Christmas spirit, I thought I’d share a new template that I have built using the native Google Analytics connector, which anyone can use as long as your website is using Google Analytics and as long as your Google account is linked up to your Google Analytics setup.
I built this template originally as an audit for websites that I have bought this year to identify where traffic is coming from, performance YoY, monthly, weekly, where the traffic is going to and on what device people are entering on as well. I figured, if it is useful for me, then it will be useful to others.
You can see what the dashboard looks like below:
Google Analytics Dashboard
Click to view the Google Analytics dashboard
Jonathan Jones
How can you create a copy?
- At the top right hand corner click the following icon:

- Hit “create new data source” (if you haven’t already added your Google Analytics to Google Data Studio):

- Find Google Analytics and then hit ‘select’


- Select ‘All Web Site Data’:

From there, you should be able to add this as a data source for the report/template I’ve created for you.
Enjoy!
Read on if you want to read about the rationale behind the report:
Filters
Filters are one of the most important aspects for me and when I drill down into any website to look for issues or to see why things are the way they are – I use filters – an important part of Google Data Studio, and the reason why I always put them at the top of my report.
You can see below that I have added the following dimensions, but you’re more than welcome to change the dimensions to suit your own needs & requirements:
- Medium
- Landing Page
- Device Category
- Country
- Date selector

Overview
Next up is the ‘overview’ section where you can quickly get to grips with how things are looking from a YoY perspective:

Country & Device Type
Here in this part of the dashboard you’ll be able to see a table that contains all of the countries where your website is getting traffic, and then importantly, you can see that trended to identify if there are any ‘break out’ countries which might be influencing your data set.
I have also decided to include in this section a device type report so that you can see which devices your users are coming in from and I’ve used a neat looking stacked bar chart so you can see at what % rate by device your users are using your website:

Top medium / source
Here you can see traffic being driven to your website by medium / source. This will again allow you to see if you’re perhaps by chance gaining more traffic from other search engines like Bing or if you are receiving more referral traffic due to some work that your partnerships team have been doing:

Landing Pages
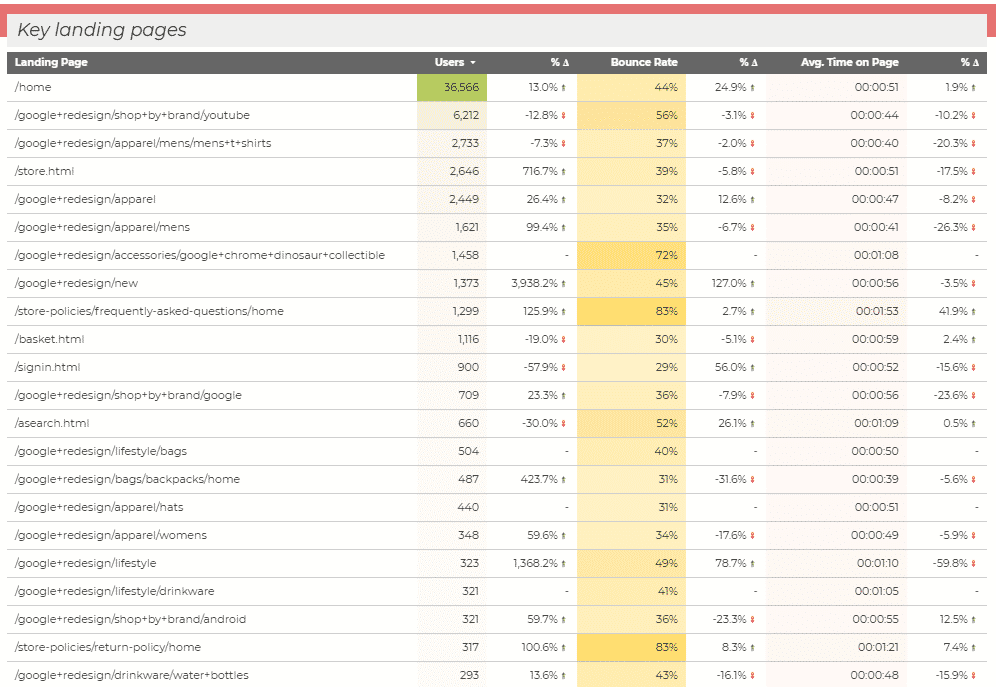
Finally, you’ll want to what your most important pages are by traffic and other metrics. I’ve defaulted to Users, Bounce Rate, and Avg. Time on Page, but this is where I would put metrics like Conversion Rate, Revenue and other goal related metrics:

Go at it, copy it, and make it better!
It’s a fairly straightforward report, so hopefully this will be good inspiration to either adapt this template to what is suitable for you or even if you’re building a new report from scratch. Hopefully this will be helpful and useful for someone. 🙂
I was encouraged a little to create this because I had a great time in Zurich and had some good chats with the likes of Dixon Jones and Dawn Anderson. Dawn referred to the fact that she had actually pointed people my way to the Google Data Studio template I had created last year, which sort of gave me a boost in putting this article together and sharing another template out to the community.
Feel free to read some of my other guides on Google Data Studio:

Leave a Reply